Financial overview

| Indicator, RUB m | 2018 | 2019 | Change, % |
|---|---|---|---|
| Revenue | 56,993 | 56,673 | (1) |
| EBITDA | 10,572 | 12,231 | 16 |
| EBITDA margin | 19% | 22% | 3 pp |
| CAPEX | 5,304 | 3,838 | (28) |
| Indicator, RUB m | 2018 | 2019 | Change, % |
|---|---|---|---|
| Port Division | 13,121 | 15,409 | 17 |
| Rail Division | 11,791 | 8,232 | (30) |
| Liner and Logistics Division | 35,875 | 37,944 | 6 |
| Shipping Division | 2,767 | 3,245 | 17 |
| Bunkering Division | 1,018 | 1,191 | 17 |
| Eliminations | (7,579) | (9,348) | 23 |
| FESCO Group | 56,993 | 56,673 | (1) |
In 2019, the Group’s consolidated revenue stood at RUB 56,673 million (almost flat YoY) vs RUB 56,993 million in 2018. All business segments except for the Rail Division showed YoY growth of revenue. A decrease in the Rail Division’s metric is due to worsened market conditions in grain transportation and steps taken by FESCO to divest from this business segment.
In 2019, the Port Division’s revenue went up 17%, or RUB 2,288 million, to RUB 15,409 million vs RUB 13,121 million in 2018. The key drivers were growth in import and export turnover of container cargo by 17%, changes in rates and cargo structure along with an increase in general cargo turnover by 5%, and growth in vehicle and oil products turnover by 28% and 5%, respectively.
Worsened market conditions in grain transportation led to a decrease in the Rail Division’s revenue by 30%, or RUB 3,559 million, to RUB 8,232 million. At the same time, revenue from the core fleet, including fitting platforms and box cars, grew by 46% both on the back of expansion and introduction of new routes for box cars.
The Liner and Logistics Division’s revenue went up 6% YoY, or RUB 2,069 million, due to increased transportation driven by higher quality services and new routes.
The Shipping Division’s revenue increased by 17%, or RUB 478 million, primarily on the back of charters (Antarctic expedition, contracts with the Russian Ministry of Defence) and higher rates post the fleet upgrade.
| Indicator, RUB m | 2018 | 2019 | YoY change, % |
|---|---|---|---|
| Port Division | 5,618 | 6,753 | 20 |
| Rail Division | 6,758 | 3,788 | (44) |
| Liner and Logistics Division | 31,934 | 32,834 | 3 |
| Shipping Division | 1,944 | 2,180 | 12 |
| Bunkering Division | 960 | 1,140 | 19 |
| Eliminations | (7,579) | (9,415) | 24 |
| FESCO Group | 39,634 | 37,279 | (6) |
In 2019, FESCO’s operating expenses went down 6% to RUB 37,279 million vs RUB 39,634 million in 2018, due to a decrease in grain transportation.
The Port Division’s operating expenses went up 20%, or RUB 1,135 million, mainly due to higher variable expenses resulting from increased cargo turnover and repair and maintenance costs.
The Rail Division’s operating expenses shrank by 44%, or RUB 2,970 million, on the back of lower grain transportation volumes, while those of the Liner and Logistics Division grew by 3%, or RUB 900 million, due to higher transportation volumes and railway tariff expenses on terminal services and road transportation. On top of that, FESCO saw its intra-group expenses related to fitting platform operating lease increase due to the relevant fleet expansion and higher lease rates.
The Shipping Division’s operating expenses went up 12%, or RUB 236 million, largely due to an increase in charters (Antarctic expedition, contracts with the Russian Ministry of Defence).
Gross profit
In 2019, FESCO’s gross profit stood at RUB 19,394 million vs RUB 17,359 million in 2018.
| Indicator, RUB m | 2018 | 2019 | YoY change, % |
|---|---|---|---|
| Salary and other staff related costs | 4,901 | 5,028 | 3 |
| Professional fees | 610 | 642 | 5 |
| Office rent | 333 | 347 | 4 |
| Other administrative expenses | 1,139 | 1,323 | 16 |
| Total administrative expenses | 6,983 | 7,341 | 5 |
In 2019, FESCO’s administrative expenses grew 5 % to RUB 7,341 million vs RUB 6,983 million in 2018, which is mainly attributable to higher payroll and staff grading expenses.
| Indicator, RUB m | 2018 | 2019 | YoY change, % |
|---|---|---|---|
| Port Division | 5,889 | 6,787 | 15 |
| Rail Division | 4,094 | 3,596 | (12) |
| Liner and Logistics Division | 1,259 | 2,309 | 83 |
| Shipping Division | 664 | 776 | 17 |
| Bunkering Division | 36 | 83 | 131 |
| Extra-divisional Group | (1,372) | (1,319) | 4 |
| FESCO Group | 10,572 | 12,231 | 16 |
| Indicator, % | 2018 | 2019 | YoY change, pp |
|---|---|---|---|
| Port Division | 45 | 44 | (1) |
| Rail Division | 35 | 44 | 9 |
| Liner and Logistics Division | 4 | 6 | 2 |
| Shipping Division | 24 | 24 | 0 |
| Bunkering Division | 4 | 7 | 3 |
| FESCO Group | 19 | 22 | 3 |
In 2019, the Group’s consolidated EBITDA increased by 16% to RUB 12,231 million vs RUB 10,572 million in 2018. EBITDA margin went up 3 pp to 22% vs 19% in 2018. The Liner and Logistics Division together with the Port Division were the major contributors to the metric’s growth.
The Port Division’s EBITDA increased by 15%, or RUB 898 million, mainly driven by the market expansion in the reporting year and larger handling volumes for all cargoes. Thanks its strong commercial strategy, the Division’s container handling volumes grew much faster than the market, which helped increase FESCO’s share in the Russian Far East to an all-time high of 44%.
The Rail Division’s EBITDA dipped by 12% YoY, or RUB 498 million, as the Division’s performance was under pressure from negative trends in the grain railway transportation market.
The Liner and Logistics Division’s EBITDA increased by 83%, or RUB 1,050 million, on the back of optimised rotation of international shipping lines from China and the Republic of Korea and better efficiency of Baltic lines. The Division saw the financial performance improve across all domestic transportation routes. Intermodal transportation expanded on the back of shorter cargo handling at all legs driven by accelerated customs transit clearance, improved railcar turnaround, and electronic records management.
The Shipping Division’s EBITDA increased by 17%, or RUB 112 million, thanks to earnings from the Antarctic expedition, contracts with the Russian Ministry of Defence and improved fleet performance post upgrade.
| Indicator, RUB m | 2018 | 2019 | YoY change, % |
|---|---|---|---|
| Port Division | 639 | 678 | 6 |
| Rail Division | 1,225 | 1,945 | 59 |
| Liner and Logistics Division | 107 | 285 | 166 |
| Shipping Division | 429 | 459 | 7 |
| Bunkering Division | – | – | – |
| Extra-divisional group | 80 | 118 | 47 |
| FESCO Group | 2,480 | 3,485 | 41 |
Depreciation and amortisation charges grew by 41 % to RUB 3,485 million vs RUB 2,480 million in 2018 as a result of adopting new IFRS 16 standard effective from 2019.
Profit/(loss) from operating activity
In 2019, FESCO’s profit from operating activity stood at RUB 8,304 million vs RUB 8,334 million in 2018.
Other financial expenses
FESCO’s other financial expenses increased from RUB (441) million in 2018 to RUB (7,373) million in the reporting year due to exchange differences and interest expenses accrued in accordance with new IFRS 16 standard.
Share of profit of equity accounted investees
The Group’s share of profit of equity accounted investees went down to RUB 77 million vs RUB 1,662 million in 2018 due to the disposal of investment in TransContainer in October 2018.
Profit/(loss) before income tax
In 2019, FESCO’s profit before income tax stood at RUB 740 million vs RUB 9,954 million in 2018.
| Indicator, RUB m | 2018 | 2019 | YoY change, % |
|---|---|---|---|
| Current tax expense | |||
| Current period | 2,447 | 2,292 | (6) |
| Deferred tax expense | |||
| Origination and reversal of temporary differences | 498 | 290 | (42) |
| Total income tax expense | 2,945 | 2,582 | (12) |
Income tax expense fell by 12% to RUB 2,582 million vs RUB 2,945 million in 2018. Current tax expense for the period decreased by 6% to RUB 2,292 million vs RUB 2,447 in 2018 mainly as a result of the Rail Division’s poorer financial result.
Net profit/(loss)
Net loss stood at RUB (1,842) million vs net profit of RUB 7,009 million in 2018.
| Indicator, RUB m | 31.12.2018 | EBITDA | 31.12.2019 | EBITDA |
|---|---|---|---|---|
| (Cash and cash equivalents) | (3,313) | (0.3х) | (1,232) | (0.3х) |
| Debt obligations and finance lease liabilitiesLoans and obligations do not include operating lease obligations, so to calculate ratios, EBITDA excluding the impact of the IFRS 16 adoption is also used. | 45,647 | 4.7х | 39,294 | 3.8х |
| Short-term | 4,695 | 6,659 | ||
| Long-term | 40,952 | 32,635 | ||
| Net debt | 42,334 | 4.4х | 38,062 | 3.7х |
FESCO’s liabilities as at 31 December 2019:
- RUB 32,632 million – loans and borrowings;
- RUB 6,410 million – lease liabilities;
- RUB 252 million – BO-01 and BO-02 series exchange-traded Russian bonds.
- Net debt shrank from RUB 42,334 million as at 31 December 2018 to RUB 38,062 million.
- Net debt / EBITDA ratio as at 31 December 2019 decreased to 3.7x (excluding IFRS 16 impact).
Capital expenditures
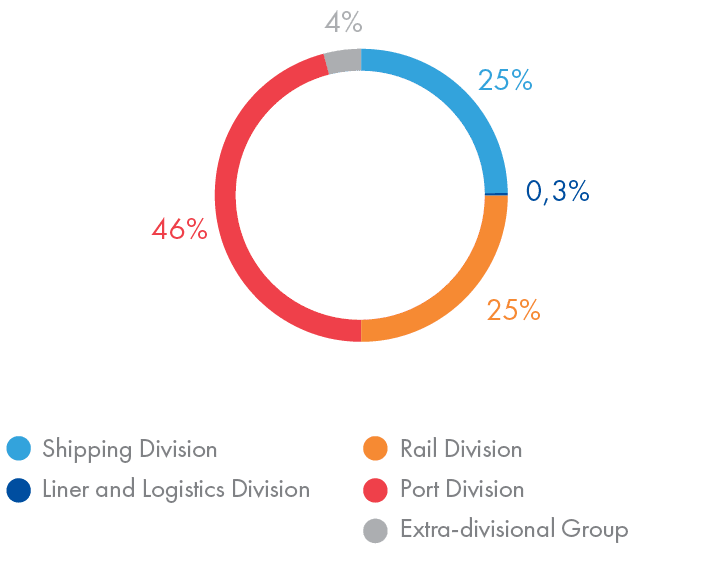
The Group’s CAPEX stood at RUB 3,838 million, with 96% of this amount attributable to the Port, Shipping and Rail Divisions.
The Port Division accounted for 46%, or RUB 1,749 million, of FESCO’s CAPEX, the bulk of which is associated with investments in port infrastructure and cranes and mechanisation (RUB 883 million and RUB 754 million, respectively).
The Shipping Division made up 25%, or RUB 976 million, of the Group’s CAPEX. In 2019, FESCO added two 822 TEU ice-class container carriers, FESCO Magadan and FESCO Moneron, to its fleet. The vessels cost RUB 701 million, with dry docking expenses amounting to RUB 275 million.
The Rail Division accounted for 25%, or RUB 959 million, of CAPEX due to the purchase and repair of wheel sets.